Planning: fill rate per area and day, events with start and end, charts above the crew
The planning changes of August and September in EVENTRA: a planning overview that shows the fill rate per area and day, events with a start and end date instead of a day count, clickable charts above the staff table, a file drive with trash and AI suggestions for area icons.
In short
- The planning overview is a grid of areas by days: every cell shows the fill rate from accepted and open shifts. Where it is red, crew is missing.
- An event now has a start, an end and optional times. The event days follow from that instead of being entered as a number.
- Above the staff table sit clickable charts on status, employment type and activity. One click filters the table.
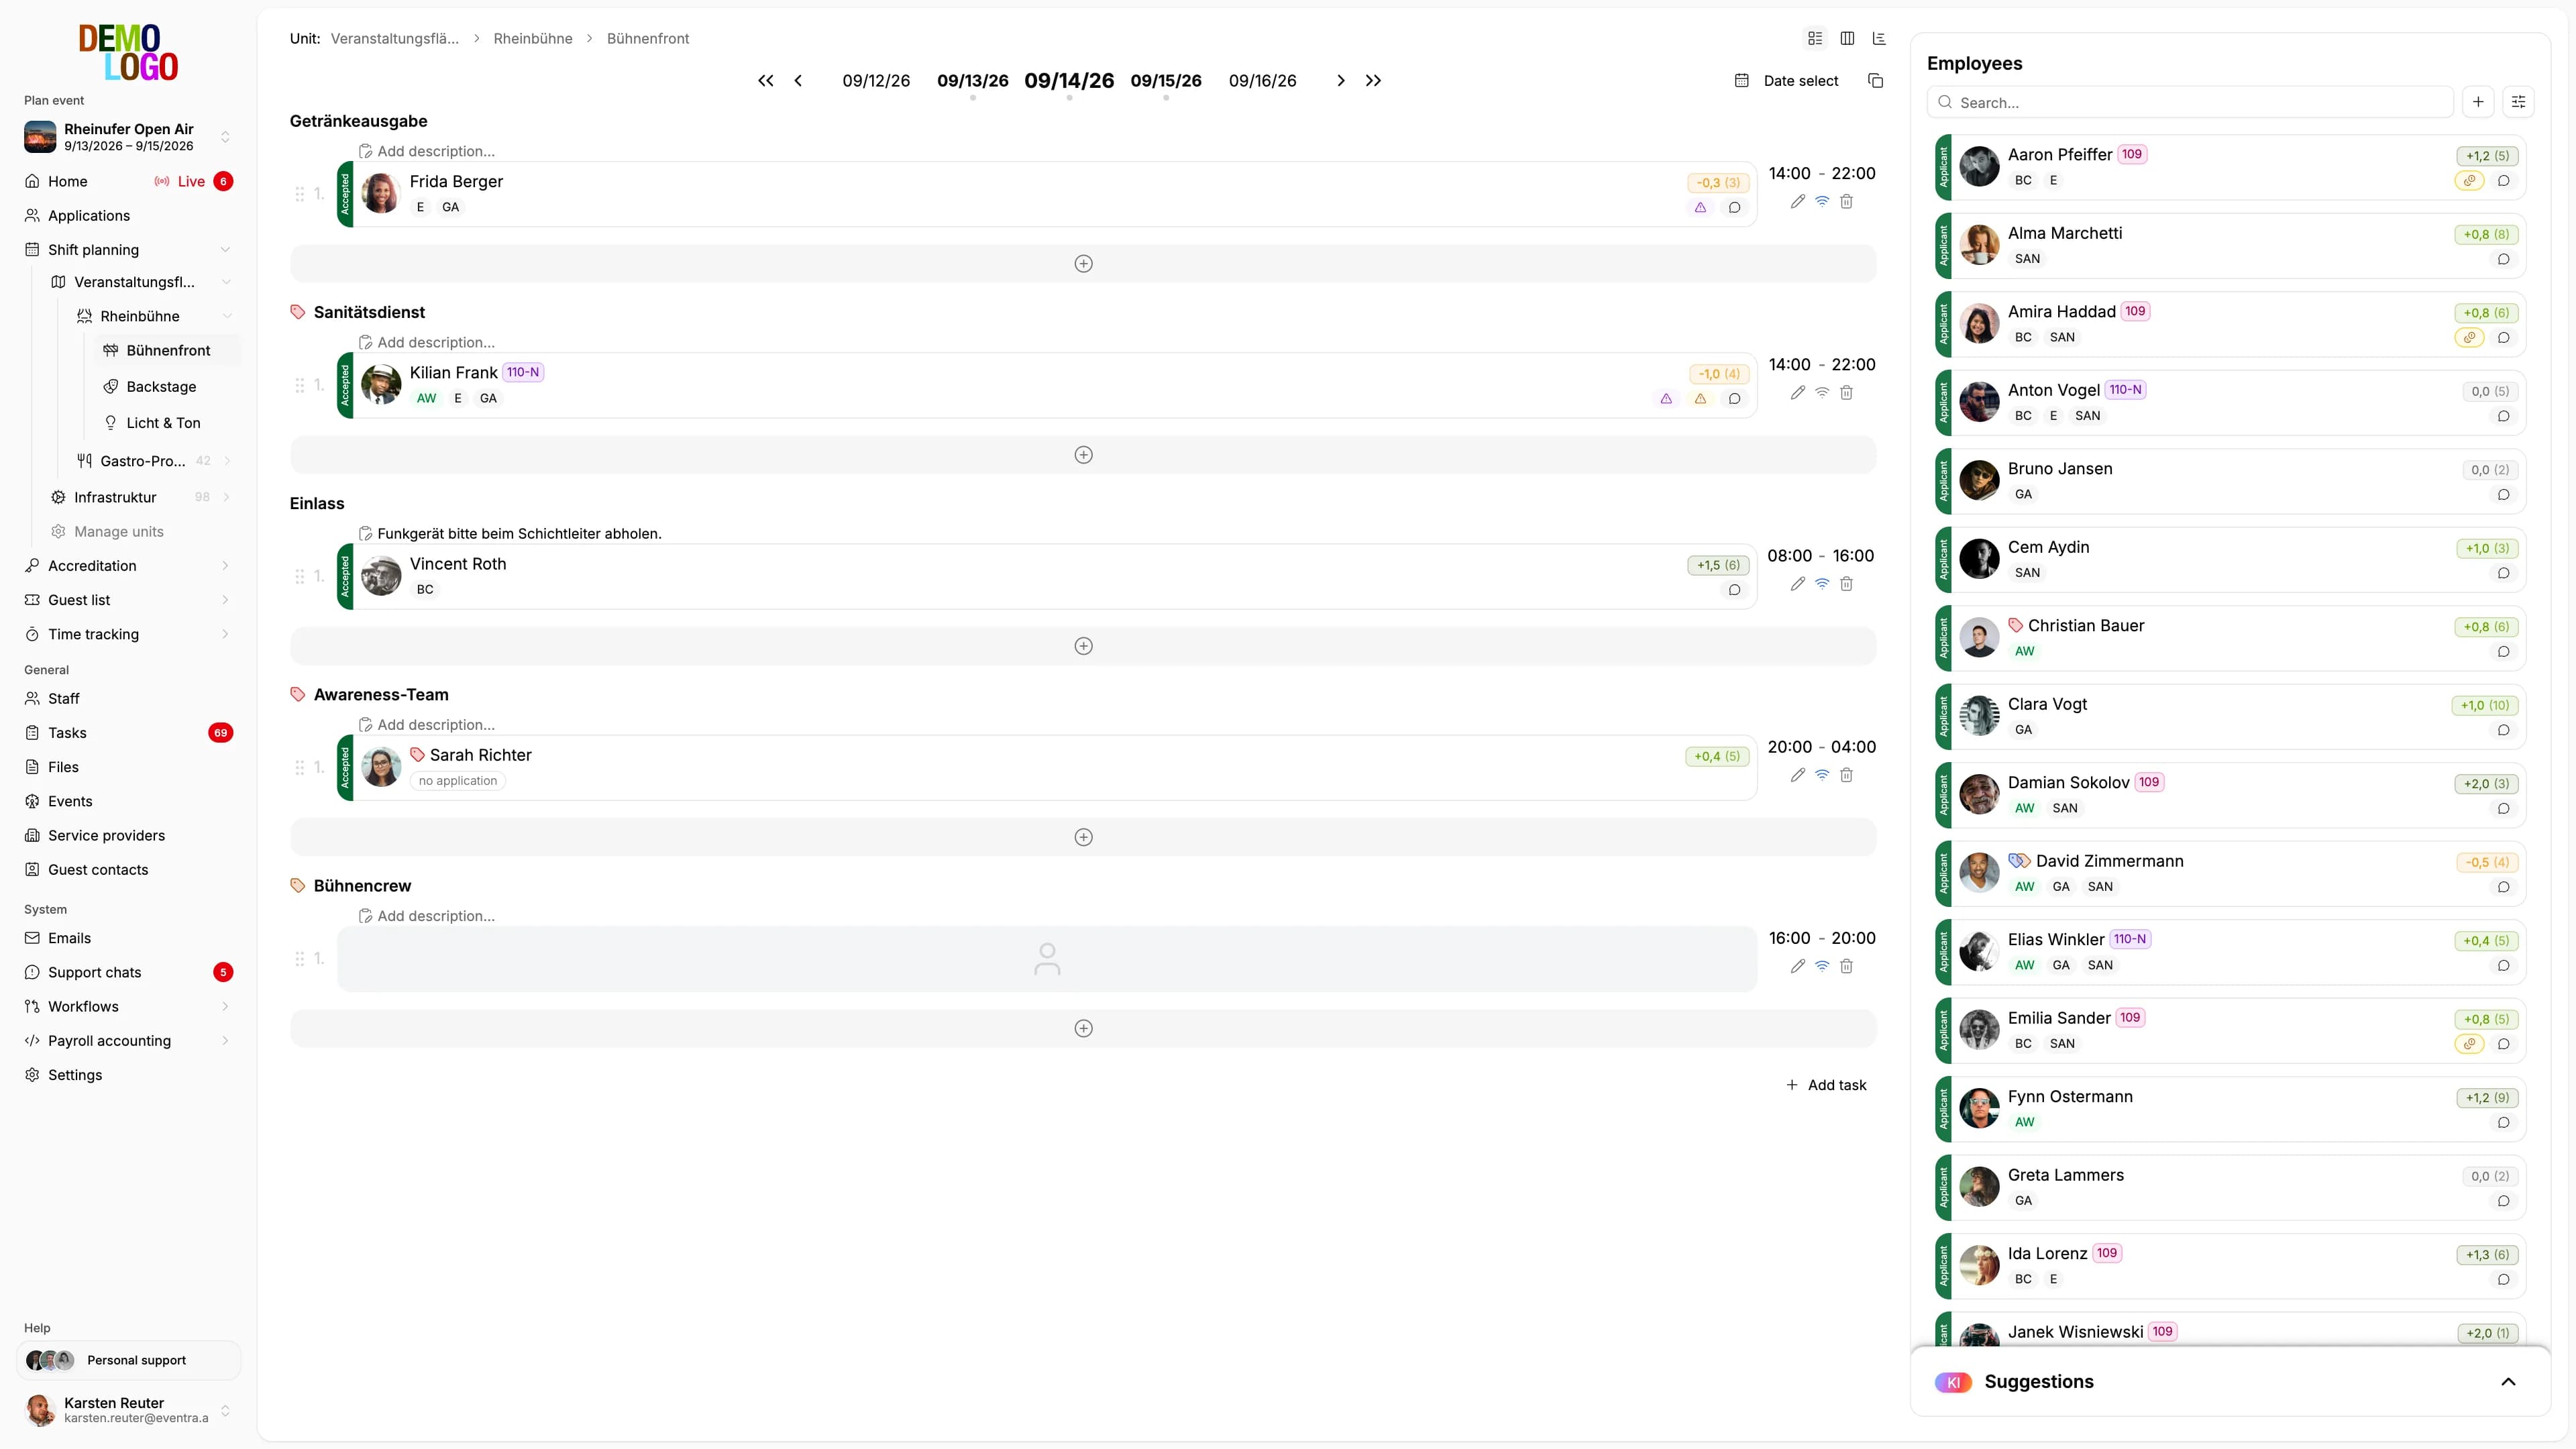
Three questions a planning desk asks daily in summer: where is crew still missing? When does the event actually start? And who of the 800 people in the pool is currently active? The changes of the last weeks answer all three without Excel.
Planning overview: areas by days
The shift plan shows shifts. For the question whether the event as a whole is staffed, it was too detailed. The new planning overview, a tab next to the shift plan, is a grid: rows are the areas, columns the event days, and every cell shows the fill rate from accepted shifts against all shifts. Stage North on Saturday 12 of 15, Gate South on Friday 4 of 20. Where it is red, crew is missing; the shift plan is one tab over.
Events with start and end
An event used to be created with a start date and a number of days. That was fine for a three-day festival and awkward for everything else: a build-up and tear-down over two weeks, a congress with a pre-day. Since 7 September an event has a start date, an end date and optional times. The event days follow from that. Existing events were converted; their shifts stay on their days.
Charts above the staff table
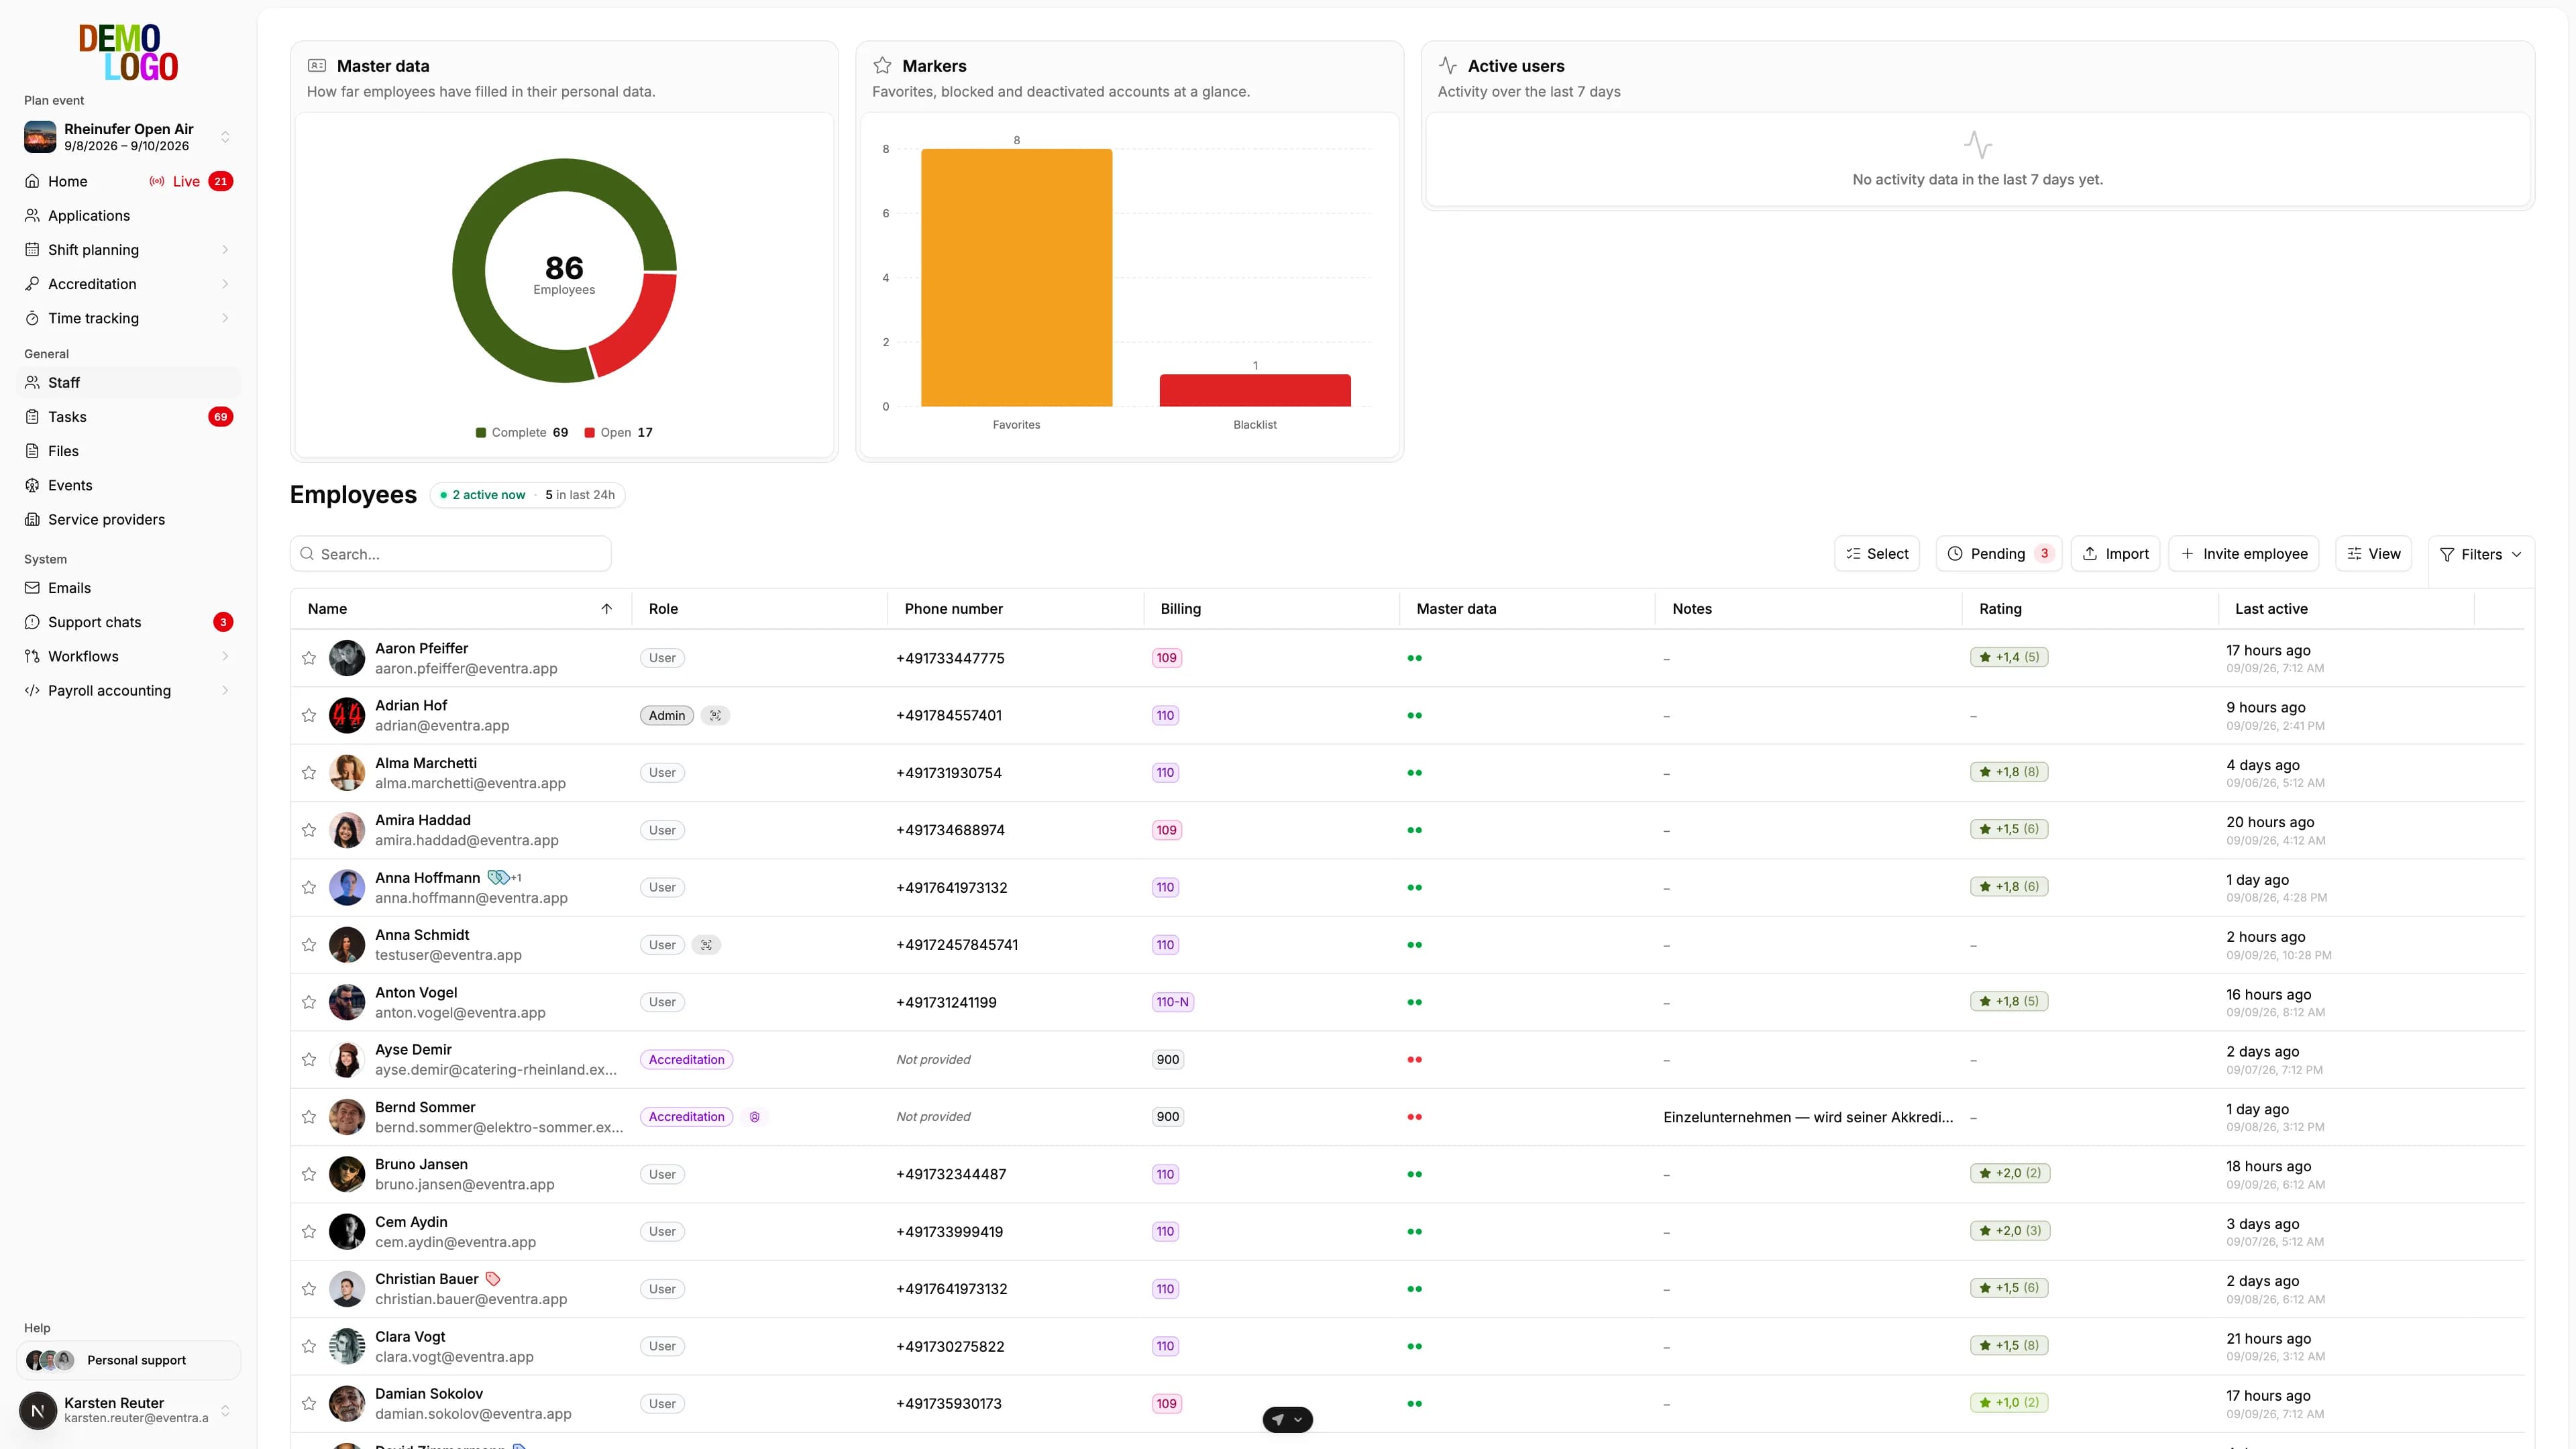
The staff table lists the whole pool. Above it now sit clickable charts on status, employment type and activity. A click into a segment filters the table, and several clicks combine. Whoever wants to know how many short-term employees have recently been inactive clicks twice.
File drive with trash
The tenant's files page, where contracts, templates and plans live, has shown owner and last change per file since 9 September. Favourites apply to the whole tenant, not per person. Deleted files go to the trash, from which they can be restored before they disappear for good.
Smaller things from the summer
When an area is created, the AI has suggested an icon since 10 August, matching the name, from a fixed pool of around a hundred. Existing areas without an icon can be filled in one pass. The GastroPIN emails for till crew have gone out in the person's language since 4 August, German or English. And completed AI translations appear in the interface immediately, without a reload.
What the planning overview does not replace is the AI suggestion per open shift: it shows where crew is missing; who fits, the plan suggests.